
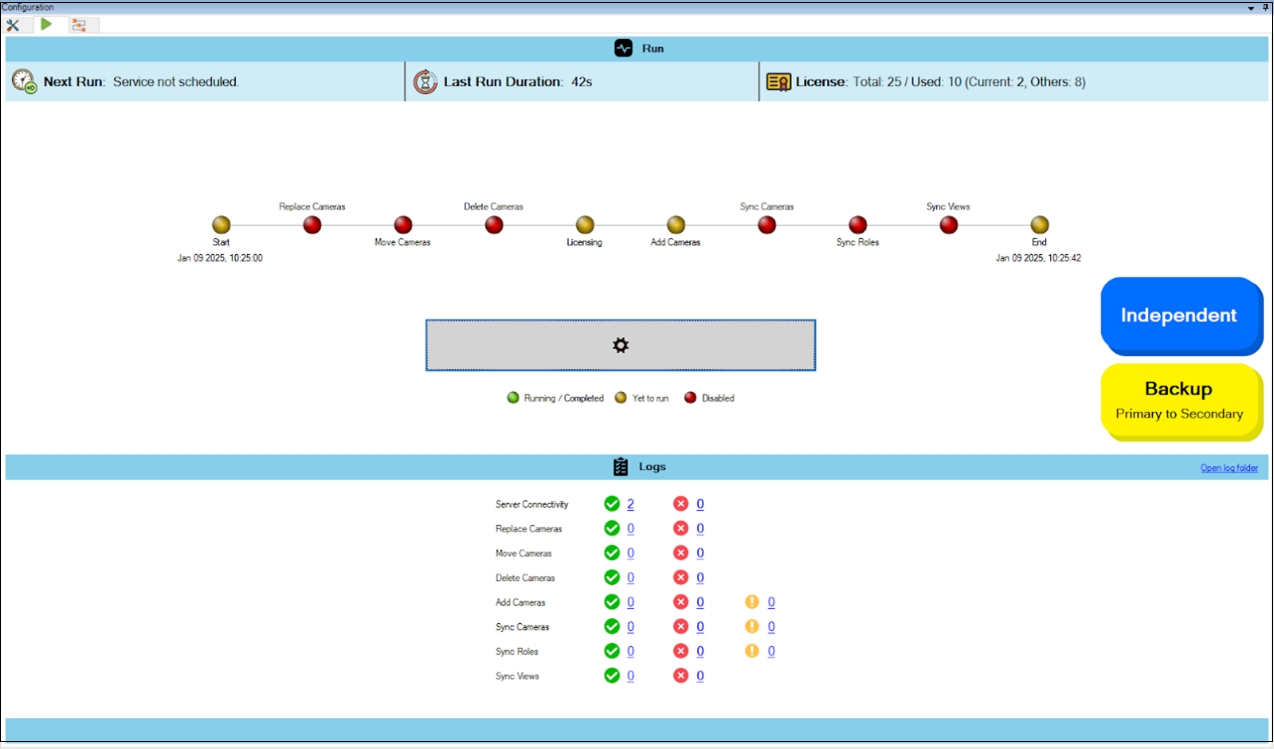
Run/Process Dashboard Details
The Run/Process dashboard enables users to efficiently monitor sync processes.

Next Run
Next Run shows the scheduled time for the system to execute the synchronization process automatically.
Last Run Duration
Last Run Duration displays the total time to complete the most recent synchronization operation.
License
The License utilization section displays the total number of RMF licenses purchased versus those currently in use. It also monitors license usage across multiple sites, ensuring optimal allocation of licenses. Additionally, the License Count indicates the total number of licenses used or available within the system, ensuring proper monitoring and compliance with licensing limits.
Process Workflow Visualization
The process workflow visualization displays the stagewise status of the sync process.
When a synchronization run is not in progress, the color of the LED indicates whether a stage is enabled or not.
Enabled (green): Indicates that the process is running or scheduled to run as expected. Once the stage is successfully processed, the indicator will turn solid green.
Disabled (red): Indicates that the stage is disabled, preventing both scheduled and manual executions.
When a synchronization run is in progress, the color of the LED indicates the status of the execution of a particular stage.
Running/Completed:
When a stage is in progress, its indicator blinks green.
When a stage has been completed, its status indicator is solid green.
Yet to run: Yellow indicators signify stages that are enabled but have not yet started or completed processing.
Disabled (red): Indicates that the stage is turned off, and synchronization for it will not be executed.
Manual Run Button
The manual run button enables users to initiate a synchronization run on demand, bypassing the need to wait for the next scheduled run. This is useful when users prefer to launch a run manually rather than scheduling a sync, or when they have a planned sync but need to execute a run before the next scheduled time.

Illustrative Run Operation
Open Log Folder
The Open Log Folder feature allows users to access the directory where execution logs are stored. This feature provides direct access to log files, allowing you to review detailed records of run activities, troubleshoot errors, and analyze system behavior. It helps in debugging issues by offering a comprehensive view of past executions.
Logs Section
Displays status logs for each process step, categorized into:
✅ Successful Operations (Green Checkmark): Clicking on the number next to this icon will open a notepad-style log displaying details of all completed operations.
❌ Failed Operations (Red X): Clicking next to this icon will open a notepad-style log with error messages and reasons for failure, helping users troubleshoot issues.
⚠️ Warnings (Yellow Exclamation Mark): Clicking next to this icon will open a notepad-style log highlighting potential issues or warnings that may not have caused failure but need attention.
Last updated